We collect basic website visitor information on this website and store it in cookies. We also utilize Google Analytics to track page view information to assist us in improving our website.
Written by: Cole White
There are many ways of understanding plants. Scientific study, home gardening, ecological restoration work, and traditional knowledge modalities all offer people significant ways to meaningfully connect with plants and gain an appreciation for the services and beauty they offer.
My interest started with growing up in a rural area and being intrigued by the wild edible plants, such as Lamb's Quarters and Mint, that could be found in my backyard. Later I worked at a botanical garden, which got me interested in more big-picture topics like forest succession and pollination. Now, as a GIS technician at Dougan and Associates and part of the Network of Nature team, I often engage with plant knowledge using data, and databases.

The species pages you can explore on the Network of Nature website are powered by an underlying database– that is, an organized collection stored and accessed on a computer. This database contains names, photographs, and various traits (such as native and introduced geographic ranges, bloom colour, and compaction tolerance) for about 5,000 plant species that occur in Canada, all stored in a way that is structured and easily retrieved, modified, or analyzed.
While there may be nuances of biology a typical database system cannot capture, and complex questions these technologies cannot answer in full, the beauty of storing information this way is that it allows us to analyze the collected data in ways that can give us useful (or at least interesting) insights, or raise new questions to inspire further investigation.
One question we recently considered is what a phylogenetic tree created from the Network of Nature database would look like and what further research and exploration this could inspire.
A phylogenetic tree (or 'tree of life') is a branching diagram, visually tracing the evolutionary lineage of a set of organisms back to a common ancestor. All of life on Earth could be traced back to a single ancestor this way. Phylogenetic trees created from more specific datasets are increasingly being used in ecological and biogeographic studies that allow us to learn more about biology and evolution.
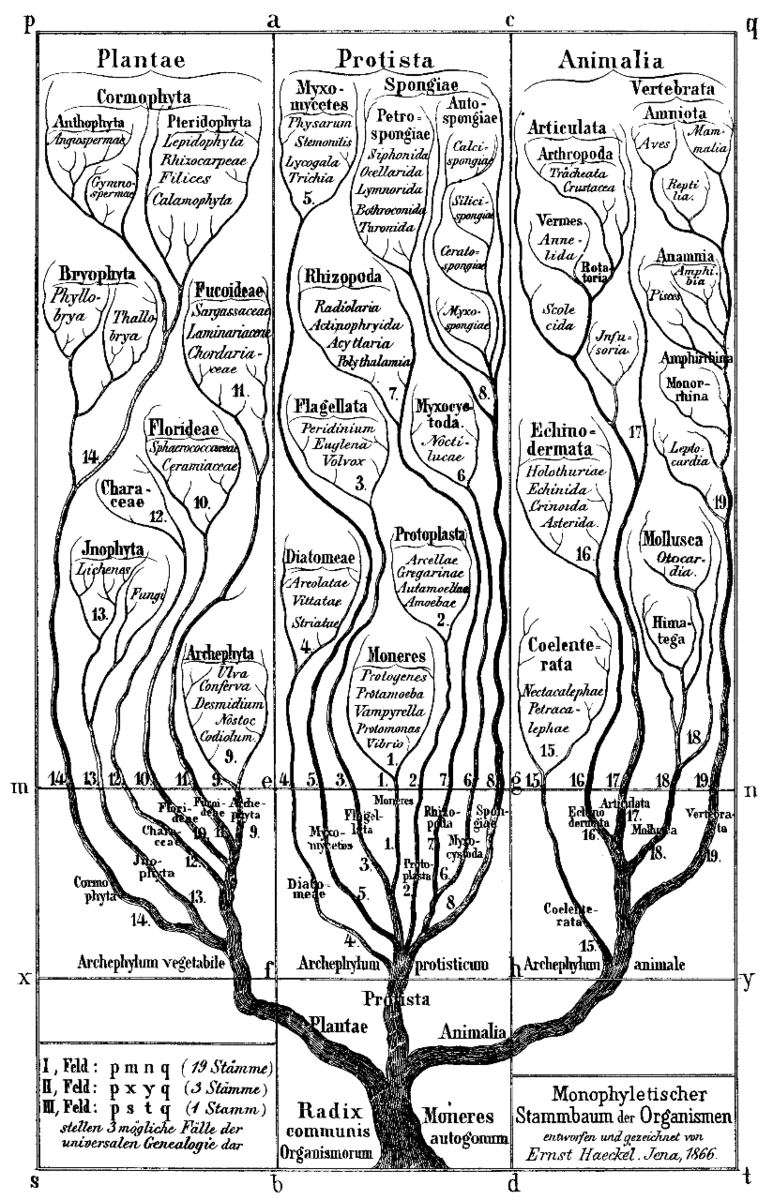
A 19th-century phylogenetic tree.
Phylogenetic trees used to be hand-drafted by scientists, but can now be created quickly and easily using open source tools developed by unselfish computer programmers. I used the R programming language and an R package called V.Phylomaker to generate a phylogeny based on the Network of Nature database, and a Neo4j graph to store and visualize the results.
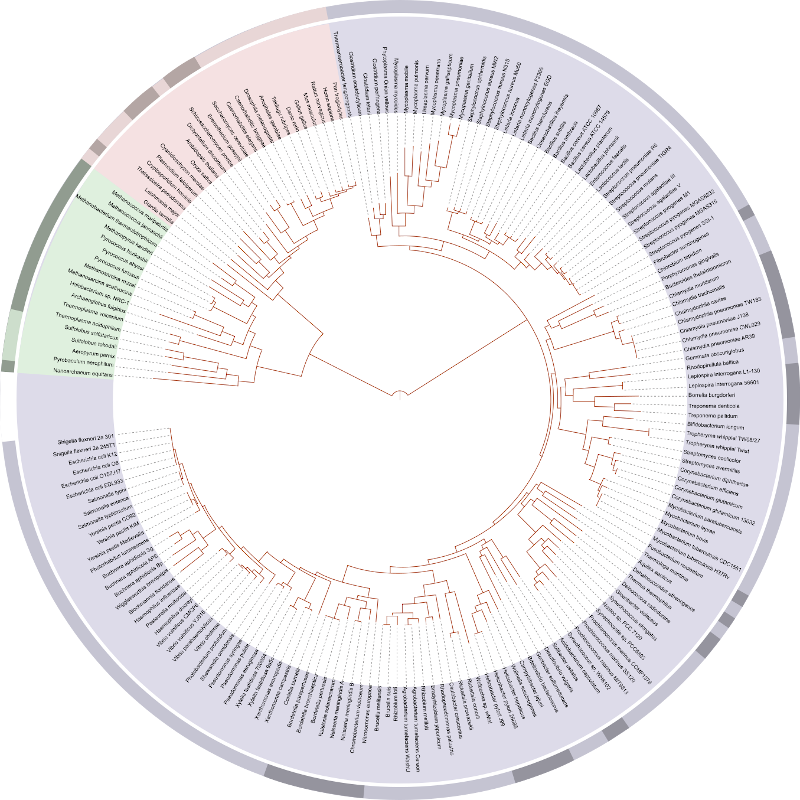
A modern tree of life based on genome sequencing.
R is a programming language widely used by statisticians and data analysts. It incorporates machine learning, linear regression, statistical inference, and other techniques to perform data science work that has applications in many different fields.
![]()
The things R can do are extended by add-ons called packages. One of these packages is V.Phylomaker, which uses a 'mega-tree' containing data related to all extant flowering plant families to build phylogenetic trees from a simple spreadsheet of plant species information.
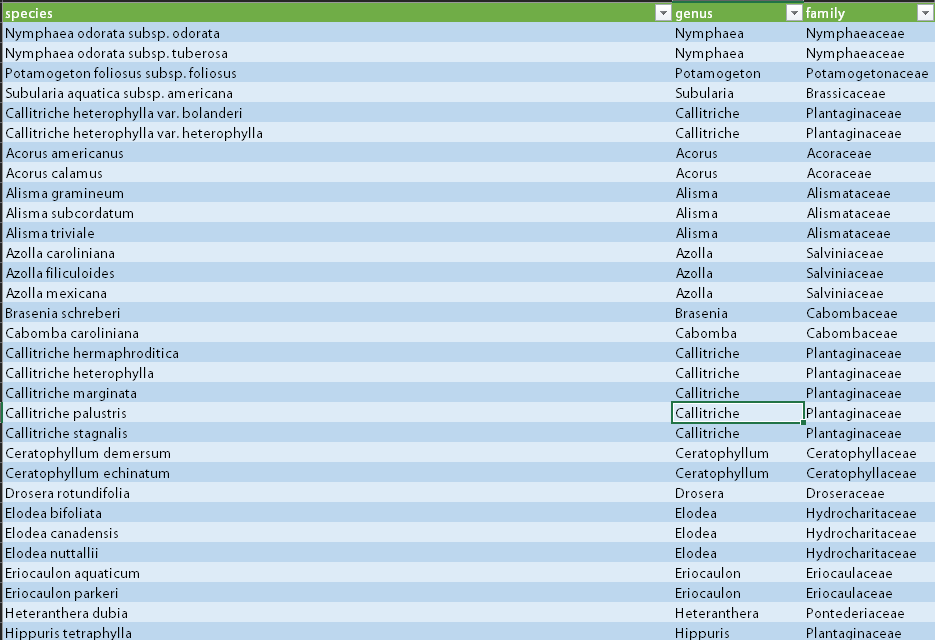
A list of species exported from Network of Nature.
Neo4j is a type of database that focuses on relationships between entities, rather than just storing rows of data. We thought this would work as an interesting tool to model the relationships between plant species.
To try this out with Network of Nature, I installed the package and used an export of the Network of Nature database as an input for a small R script using V.Phylomaker. The output of this was a phylogenetic tree in Newick format, a mathematical way of representing this kind of data.
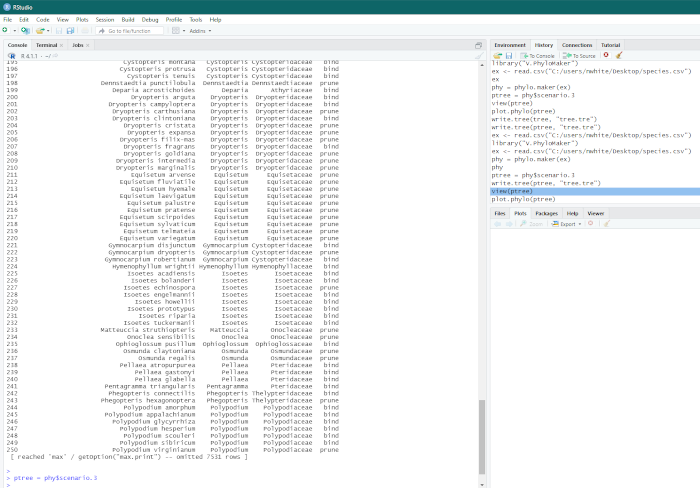
Working with plant data in RStudio.
Next, I used a Python script and the Biopython package to read this Newick data and use it to populate a Neo4j graph.
The result was a dataset of interconnected plant species that could easily be visualized, queried, and explored.
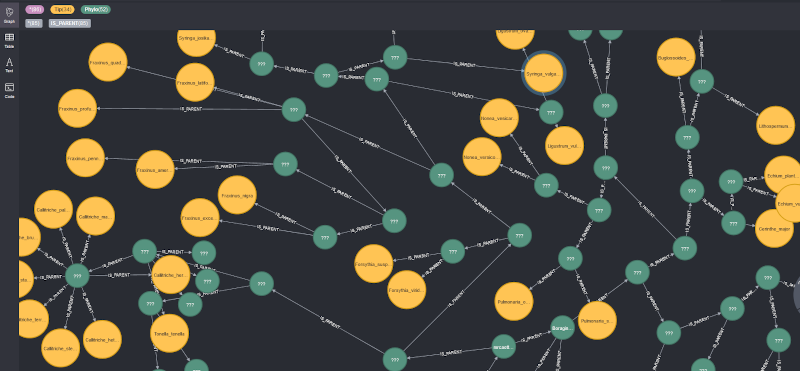
A Network of Nature phylogenetic tree visualized using a graph.
We’re excited to continue exploring the benefits of incorporating a phylogenetic approach into the Network of Nature database. We anticipate that capturing evolutionary relationships among plants will help to deepen our collective understanding of the diversity of plant species found across Canada, and advance the tools and approaches that are used in conservation planning, ecological restoration, gardening, and a wide range of other biodiversity initiatives.
Feel free to reach out to our team if you’re interested to learn more about what we’re doing at Network of Nature.
Join our email list to receive occasional updates about Network of Nature and ensure you get the news that matters most, right in your inbox.
